Double-Exponential FLIM-FRET Approach
is Free of Calibration
Wolfgang Becker, Axel
Bergmann, Becker & Hickl GmbH
Abstract: A new double-exponential FLIM-FRET approach
obtains FRET parameters from a single lifetime image of the donor. The
technique makes use of the fact that the donor decay functions contain a
component from non-interacting donor. Becker & Hickl SPCImage NG data
analysis software determines the lifetimes and the amplitudes of the decay
components. From these, SPCImage calculates the classic FRET efficiency, the
FRET efficiency of the interacting donor, the amount of interacting donor, and
the ratio of the donor-acceptor distance to the Förster radius. By using the
lifetime of the non-interacting donor fraction as a reference lifetime the method
avoids the need for reference data from separate donor-only cells. This not
only makes the technique easy to use but also prevents differences in the
metabolic state or in the molecular environment from influencing the FRET
results. At the end of this application note we present a protocol for
double-exponential FRET analysis with bh SPCImage NG.
Förster Resonance Energy Transfer (FRET)
Förster resonance energy transfer (FRET) is an interaction of two fluorophore molecules (or, more
exactly a fluorophore and an absorber) that are located in close distance to
each other. If the emission band of one dye - the donor - overlaps the
absorption band of the other - the acceptor - energy from the donor is
transferred to the acceptor. The principle is shown schematically in Fig. 1.

Fig. 1: Principle of FRET. Light is absorbed by one molecule, the donor,
and transferred to a second molecule, the acceptor. The energy absorbed by the
donor is finally emitted by the acceptor.
The efficiency of this process is the 'FRET
efficiency', defined as
 (1)
(1)
where IDA is the donor
intensity in presence of an acceptor and ID the donor
intensity in absence of an acceptor.
The theory of the effect was developed by
Theodor Förster and published in 1948 [18, 19]. The energy transfer rate from the
donor to the acceptor decreases with the sixth power of the distance. Therefore
it is noticeable only at distances shorter than 10 nm [21 Lakowicz Principles 1999]. Because of its
dependence on the distance FRET has become an important tool of cell biology [22,
23, 24, 25]. Different proteins are labelled with a donor and an acceptor and the
FRET efficiency is measured. The FRET efficiency is then used to proof protein
interaction or to determine donor-acceptor distances on the nm scale. Donor and
acceptor can also be linked to the same protein. The FRET efficiency is then an
indicator of protein folding and protein conformation.
Intensity-FRET measurements have a number
of problems. Intensities depend on the concentration of the fluorophore and on
the excitation power. The reference intensity, ID, cannot be
obtained under identical conditions as IDA. Calibration
measurements from different cells are required [20], which makes the technique difficult
to use and susceptible to systematic errors.
These problems are avoided by lifetime-based
FRET measurement [1, 2, 12, 13]. When FRET occurs the donor is
loosing part of its energy to the acceptor, with the effect that its
fluorescence lifetime becomes shorter, see Fig. 2, right.


Fig. 2: Förster-resonance energy transfer. The lifetime of the donor becomes
shorter when it interacts with an acceptor.
The lifetime-based FRET efficiency is:
 (2)
(2)
tDA is the donor lifetime in
presence of acceptor, tD is the donor lifetime in absence
of acceptor.
The lifetime-based FRET efficiency (2) is
equivalent to the intensity-based one under the presumption that the lifetimes,
tDA and tD , are proportional to the relative intensities IDA
and ID [5].
The use of FLIM FRET has the obvious advantage
that the FRET intensity is obtained from a single lifetime image of the donor in
the FRET system in combination with a reference lifetime image of the donor in
absence of an acceptor. The FLIM-FRET technique outlined above is easy to use
and robust. It has been used for a wide variety of protein interaction studies,
see for example [14, 15, 15, 17, 25]. For an overview on the FLIM FRET
literature please see [1].
An example is shown in Fig. 3. The cell
expresses two interacting proteins, one linked to the donor, CFP, the other to
the acceptor, YFP. FRET occurs in locations where the proteins interact. A
lifetime image is shown on the left, an image of the FRET efficiency on the
right.


Fig. 3: HEK cell expressing two
interacting proteins, one labelled with the donor, CFP, the other with the
acceptor, YFP. Donor image. Left: Lifetime image. Right: Image of the FRET
efficiency.
Fig. 4 shows how the FRET efficiency varies
throughout the cell and, consequently, where in the cell the proteins interact.
The FLIM-FRET approach is therefore commonly used for protein interaction and
protein conformation experiments. However, a close inspection of the decay
functions turns up a possible problem: The decay curves are not
single-exponential. The deviation from single-exponential behaviour is the
larger the higher the FRET efficiency is, see Fig. 4.

Fig. 4: HEK
cell, expressing two interacting proteins, labelled with CFP (donor) and YFP
(acceptor).
The multi-exponential profile of the donor
decay raises questions on the interpretation of FLIM FRET data in general and
on the applicability of the definition of the FRET efficiency. In particular,
it requires clarification of which lifetime should be used in the definition of
the lifetime-based FRET efficiency [5].
The multi-exponential decay of the FRET
donor has been ignored for many years. Now, there is little doubt that it comes
from the presence of a non-interacting and an interacting donor fraction. The
resulting donor decay functions can be approximated by a double exponential
model, with a fast component from the interacting donor molecules and a slow
lifetime component from the non-interacting donor molecules [1, 2, 13]. There are several reasons why a donor
may not interact. Its protein may just not be linked to an acceptor protein, the
acceptor protein may not be labelled with the acceptor, or the orientation
between the donor and the acceptor may be wrong. These situations are
illustrated in Fig. 5, left. Whatever the reasons of missing donor-acceptor
interaction are, the result is a double-exponential decay curve, shown schematically
in Fig. 5, right.

Fig. 5: Components
of the donor decay in FRET systems
FRET Parameters from Double-Exponential Decay Analysis
In the last decade, the capabilities of multi-exponential
FLIM recording and data analysis have increased considerably. More sensitive
detectors have increased the number of photons in the FLIM data [10], the time resolution of detectors and
TCSPC systems has increased [7, 8, 9], Maximum-Likelihood Estimation (MLE) and
intelligent binning have reduced the number of photons per pixel needed for
double-exponential FLIM analysis [3], and GPU processing has reduced the data
processing time [3].
With these improvements, FLIM data analysis
is able to deliver the lifetimes, t1 and t2, and the amplitudes, a1
and a2, of the two decay components. t1 is the lifetime of the interacting donor fraction, t2 the lifetime of the non-interacting donor fraction. The lifetime of
the non-interacting donor fraction,t2, is
identical with tD in the definition of the FLIM-FRET
Efficiency. tD can therefore be replaced with t2. By eliminating tD the classic FRET efficiency Efret,
the true FRET efficiency of the interacting donor, Einteract [1,
2, 15], the ratio of the donor-acceptor distance and the Förster radius, r/r0
, and the ratio of the number of interacting and non-interacting
donor molecules, Nfret / N0 can
be calculated exclusively from the decay parameters delivered by
double-exponential decay analysis of the donor decay:
Efret = 1- tm
/t2 , with tm = a1t1 + a2t2, amplitude-weighted lifetime
of double-exponential decay
Einteract = 1- t1 /t2
( r / r0
) = 1 / Einteract - 1 or ( r /
r0 ) = t1 / (t2 - t1), with r0 = Förster radius
Nfret / N0 = a1 / a2
The double-exponential FRET approach has
been introduced by bh already in 2004 and 2005 [2, 11, 12] but attracted little
attention. Nevertheless, it has significant advantages over the classic one.
The first one is that it does not need external
reference data from a donor-only cell. The reference lifetime is the lifetime, t2, of the non-interacting donor fraction. It is obtained from the
same measurement, the same cell, the same pixels, and the same environmental
conditions as the interacting-donor lifetime, t1. The double-exponential FRET approach is therefore more robust than
the classic one [4]. Moreover, the double-exponential approach is much easier
to use than the traditional one. Just record a FLIM data set of the sample at
the donor emission wavelength, let the FLIM analysis fit the decay data and let
it calculate the FRET parameters you are interested in.
Second, the method delivers correct classic
FRET efficiencies. In contrast to the liftime from a single-exponential fit, the
mean lifetime,tm = a1t1 + a2t2, directly
follows the donor intensity so that the FLIM-FRET efficiency reproduces the
Intensity-FRET efficiency [5].
Third, it delivers the real FRET
efficiency, Einteract, of the interacting donor. Donor-acceptor
distances calculated from this efficiency are independent of the ratio of the
amounts on interacting and non-interacting donor. This is not the case for the
classic FRET efficiency: By using an average of the donor decay components it
mingles the effects of the donor-acceptor distance and the interacting / non-interacting
donor ratio.
The fourth advantage is that the method
delivers the relative amount of interacting donor. This is real biological
information which cannot be obtained from Intensity-FRET of classic FLIM FRET
approaches.
An example is shown in Fig. 6. FLIM-FRET
data were recorded by a bh SPC-150 TCSPC FLIM module with a HPM-100-40 hybrid
detector on a Zeiss LSM 880. A single fluorescence-lifetime image was taken at
the emission wavelength of the donor. The data were analysed by bh SPCImage NG
FLIM data analysis software [3]. The FLIM data were processed using a
double-exponential incomplete-decay model and Maximum Likelihood Estimation
(MLE). Colour coding of the classic FRET efficiency, Efret, the FRET
efficiency of the interacting donor, Einteract, the donor-acceptor
distance, d/R0, and the relative amount of interacting donor was
selected to obtain images of the corresponding FRET parameters.

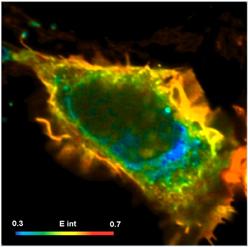


Fig. 6: HEK cell expressing two proteins labelled with Cerulean (donor)
and Venus (acceptor). Interaction occurs preferentially in the cell membrane.
Upper left to lower right: Classic FRET efficiency, Efret, (Eclass
in SPCImage), FRET efficiency of interacting donor, Einteract,
donor-acceptor distance, d/R0, relative amount of interacting donor. bh SPC-150
TCSPC FLIM module with HPM-100-40 hybrid detector, bh SPCImage NG FLIM data
analysis software running on NVIDIA GPU.
Summary
Double-exponential FLIM FRET obtains FRET
data from a single lifetime image of the donor. Reference data from other cells
are not needed. The technique uses the fact that the
donor decay function contains decay components from both non-interacting and
interacting donor molecules. The lifetime of the non-interacting donor is
identical with the donor lifetime in absence of an acceptor. It can thus be
used as a reference lifetime for the FRET calculation. Because no external
reference measurement is needed errors by possible difference in the molecular
environment or in the metabolic state of the FRET cells and the reference cells
are avoided. The technique is therefore more robust than the classic approach. It
is also easy to use because frequent swapping of FRET samples and reference
samples is avoided.
Double-exponential FLIM FRET analysis is
implemented in bh's SPCImage NG data analysis software [3]. SPCImage NG fits
the decay data in the pixels of the image with a double-exponential model.
Using the slow decay component as a reference lifetime, it calculates the
classic FRET efficiency, the FRET efficiency of the interacting donor, the
amount of interacting donor, and the ratio of the donor-acceptor distance to
the Förster radius. The data are presented as colour-coded images of the corresponding
FRET parameters. Please see Appendix of this application note.
References
1.
W. Becker, The bh TCSPC Handbook. 9th ed. Becker
& Hickl GmbH (2021)
2.
W. Becker, Advanced time-correlated single-photon counting techniques. Springer,
Berlin, Heidelberg, New York, 2005
3.
SPCImage Data Analysis, in W. Becker, The bh
TCSPC Handbook. 9th ed. Becker & Hickl GmbH (2021)
4.
W. Becker, Molecular imaging by TCSPC FLIM -
Application to metabolic imaging and FRET imaging. One-day symposium on
advanced microscopy techniques in the biomedical sciences, Charlottesville,
2023
5.
W. Becker, A Common Mistake in Lifetime-Based
FRET Measurements. Application note, Becker & Hickl GmbH (2023)
6.
W. Becker, Bigger and Better Photons: The Road
to Great FLIM Results. Education brochure, available on www.becker-hickl.com.
7.
W. Becker, C. Junghans, V. Shcheslavskiy,
High-Resolution Multiphoton FLIM Reveals Ultra-Fast Fluorescence Decay in Human
Hair. Application note, www.becker-hickl.com (2023)
8.
W. Becker, A. Bergmann, C. Junghans, Ultra-Fast
Fluorescence Decay in Natural Carotenoids. Application note, www.
becker-hickl.com (2022)
9.
Becker & Hickl GmbH, Sub-20ps IRF Width from
Hybrid Detectors and MCP-PMTs. Application note, www.becker-hickl.com (2017)
10.
W. Becker, B. Su, K. Weisshart, O. Holub, FLIM
and FCS Detection in Laser-Scanning Microscopes: Increased efficiency by GaAsP
Hybrid Detectors. Micr. Res. Tech. 74, 804-811
(2011)
11.
W. Becker, The bh TCSPC Handbook. 1st ed. Becker
& Hickl GmbH (2005)
12.
W. Becker, A. Bergmann, M.A. Hink, K. König, K.
Benndorf, C. Biskup, Fluorescence lifetime imaging by time-correlated single
photon counting, Micr. Res. Techn. 63, 58-66
(2004)
13.
W. Becker, K. Benndorf, A. Bergmann, C. Biskup,
K. König, U. Tirlapur, T. Zimmer, FRET measurements by TCSPC laser scanning
microscopy, Proc. SPIE 4431, 94-98 (2001)
14.
B. J. Bacskai, J. Skoch, G.A. Hickey, R. Allen,
B.T. Hyman, Fluorescence resonance energy transfer determinations using
multiphoton fluorescence lifetime imaging microscopy to characterize
amyloid-beta plaques, J. Biomed. Opt 8, 368-375 (2003)
15.
R. Cao, H. Wallrabe, K. Siller, S. R. Alam, A.
Periasamy, Single cell redox states analyzed by fluorescence lifetime metrics
and tryptophan FRET interaction with NAD(P)H. Cytometry Part A, 96A, 110-121
(2019)
16.
Y. Chen, A. Periasamy, Characterization of
two-photon excitation fluorescence lifetime imaging microscopy for protein
localization, Microsc. Res. Tech. 63, 72-80
(2004)
17.
R.R. Duncan, A. Bergmann, M.A. Cousin, D.K.
Apps, M.J. Shipston, Multi-dimensional time-correlated single-photon counting
(TCSPC) fluorescence lifetime imaging microscopy (FLIM) to detect FRET in
cells, J. Microsc. 215, 1-12 (2004)
18.
Th. Förster, Zwischenmolekulare Energiewanderung
und Fluoreszenz, Ann. Phys. (Serie 6) 2, 55-75 (1948)
19.
Th. Förster, Energy migration and fluorescence.
Translated by Klaus Suhling. J. Biomed. Opt. 17 011002-1 to -10 (2012)
20.
G.W. Gordon, G. Berry, X.H. Liang, B. Levine, B.
Herman, Quantitative Fluorescence Resonance Energy Transfer Measurements Using
Fluorescence Microscopy. Biophys. J. 74, 2702-2713 (1998)
21.
J.R. Lakowicz, Principles of Fluorescence
Spectroscopy, 3rd edn., Springer (2006)
22.
A. Periasamy, Methods in Cellular Imaging.
Oxford University Press, Oxford New York (2001)
23.
A. Periasamy, R.M. Clegg, eds., FLIM Microscopy
in Biology and Medicine. CRC Press 2009
24.
A. Periasamy, N. Mazumder, Y. Sun, K. G.
Christopher, R. N. Day, FRET Microscopy: Basics,
Issues and Advantages of FLIM-FRET Imaging. In: W. Becker (ed.) Advanced
time-correlated single photon counting applications. Springer, Berlin,
Heidelberg, New York (2015)
25.
Y. Sun, C. Rombola, V. Jyothikumar, A.
Periasamy, Förster resonance energy transfer microscopy and spectroscopy to
localize protein-protein interactions in live cells. Cytometry A, 83A(9),
780-793 (2013)
Appendix: Double-Exponential
FLIM-FRET Protocol
Record a FLIM image of the sample at the
donor emission wavelength. Use a filter that blocks emission from the acceptor.
For the FLIM data format, we recommend 512x512 pixels, 1024 time channels. Use
an appropriate Zoom factor so that the cell of interest reasonably fills the
image area. Keep the count rate below 106 photons per second. Higher
count rates can be recorded by the FLIM system but the cells are unlikely to
survive them. Record until you have at least 500 photons in the brightest
pixel. You can see this in the Display Parameters. When ready, stop the
measurement and save the data.


Transfer the data to SPCImage NG. Wait
until SPCImage opens and the data appear.


Upper right in the main panel of SPCImage,
select a double-exponential model. Under Options, Model, select the incomplete
decay option, specify the correct pulse repetition rate, and select the MLE fit
[3].


If you don't have a correct IRF from
earlier measurements let SPCImage create one from the recorded data or let it
optimise an existing one [3].

Select an appropriate spatial binning
factor [3, 6]. For a single cell recorded with 512 x 512 pixels we recommend a
binning factor of 2 or 3.

Start the fit procedure by 'Calculate Decay
Matrix'. Recommendation: Have a GPU installed in the computer. Processing time
without a GPU can be several minutes, with a GPU it is a few seconds [3].


The image displayed after the fit procedure
is a tm image. Click on the automatic scaling button under the
parameter histogram to scale into an appropriate parameter range. If necessary,
fine-tune the parameter range by shifting the cursors in the histogram panel or
by typing a parameter range into the Colour parameters.


Click into Options, Colour, Coding, and
select the FRET parameter you are interested in. Available are the classic FLIM
FRET efficiency, Eclass, the FRET efficiency of the interacting
donor, Eint, the relative amount of interacting donor, a1,
the ratio of interacting and non-interacting donor, a1/a2,
and the ratio of the donor-acceptor distance to the Förster radius, r/r0.
Use the Autoscale button or the cursors in the parameter histogram to adjust
the parameter range, or type the desired range into the Colour Range Min / Max
parameters.


Save the data. If you plan to publish the
images, export a bmp file.


Contact:
Wolfgang Becker
Becker & Hickl GmbH
Berlin, Germany
Email: becker@becker-hickl.com
